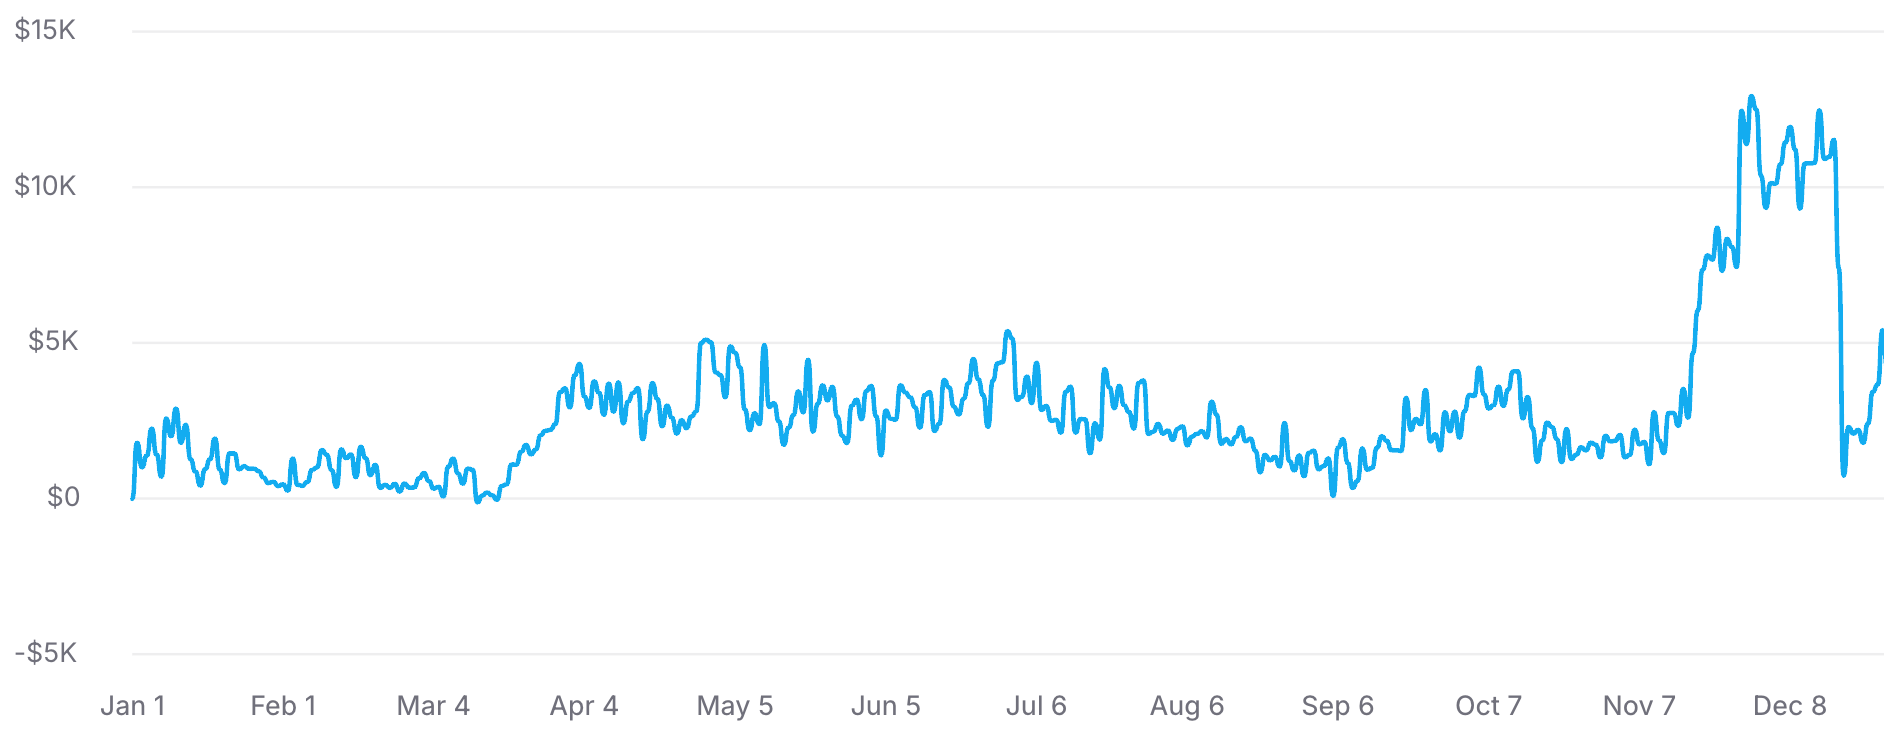
~$9.8K peak day
November 30 · Black Friday. Revenue arc accelerated from ~$29K (Nov 1–17) to ~$111K (Nov 18–30).


Launch Vector · Ecommerce Acquisition Case Study
This Launch Vector case study documents performance from a cash-flowing ecommerce business acquired through Launch Vector's partner program. Capital partners co-invested to obtain ownership in the operating company — each contributing above our $100K minimum capital contribution requirement. The results below reflect what happened after close, once ownership transferred and Launch Vector's execution framework was deployed.
Launch Vector Case Study · Seasonal Commerce · Nov – Dec 2025
$95K to $284K in 60 days — driven by volume, not price. Conversion rate improved +39.6% while traffic doubled. A structurally rare combination that signals scalable product-market fit.
The store got better under pressure. AOV held flat at ~$42 while growth was volume-driven. Three hero products grew 373–480% simultaneously — product-led, not campaign-led.
November 30 · Black Friday. Revenue arc accelerated from ~$29K (Nov 1–17) to ~$111K (Nov 18–30).
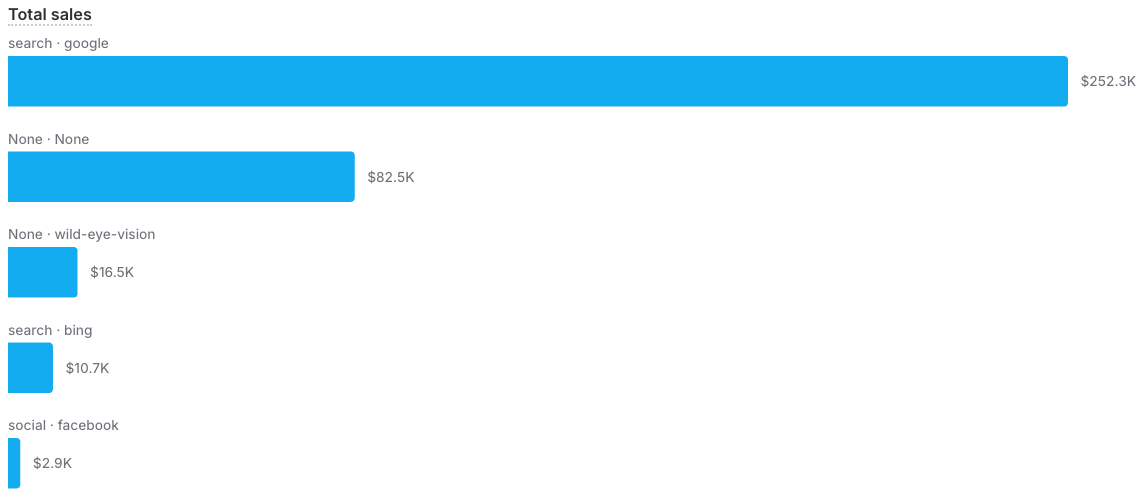
$203K+ from search at 2.88% CVR — structural channel quality, not campaign-dependent.
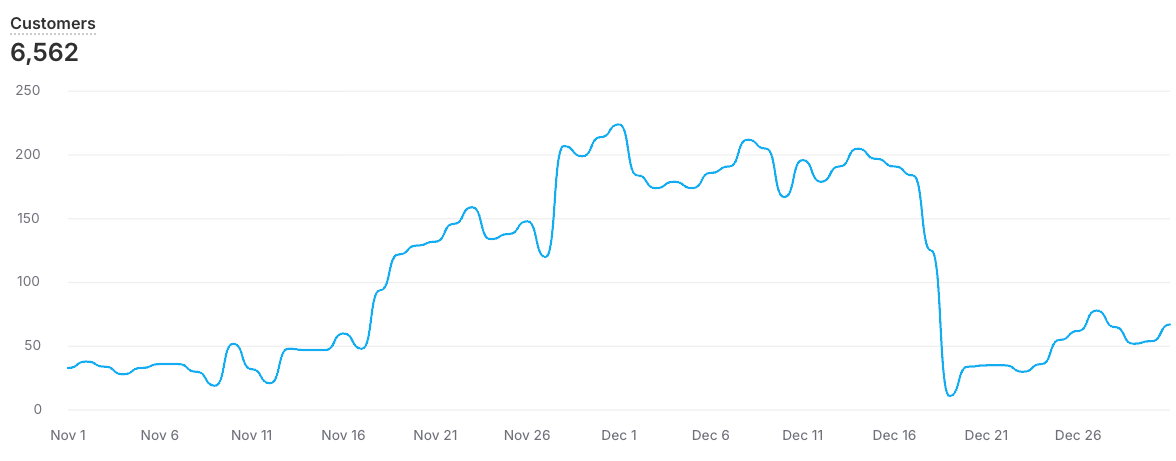
6,562 new customers in 60 days. Scalable acquisition machine — not loyalty recycling.
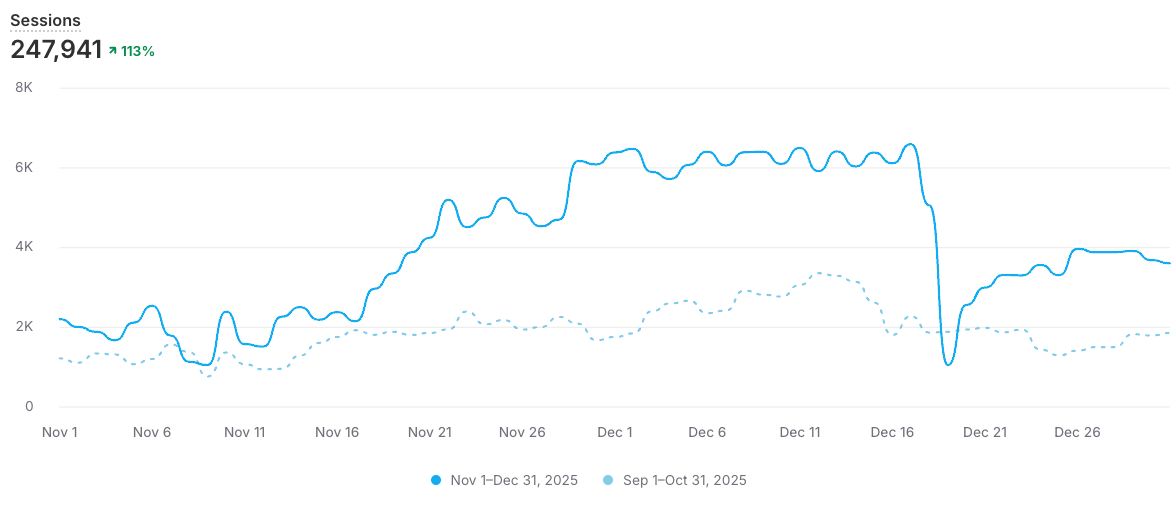
Same business. Same year. 60 days later. Immediate prior window compared head-to-head.
Sep 1 – Oct 31, 2025
Nov 1 – Dec 31, 2025
Direct exports from Shopify Analytics — the same data behind the pitch deck. Revenue arc, session load, customer acquisition, and channel mix.
Source: Shopify Analytics · Client anonymized · Nov – Dec 2025
Sessions doubled. Conversion improved. The store got better as it got bigger — the rarest signal in ecommerce.
Pre-scale baseline before Launch Vector engagement and structural optimization.
Conversion efficiency improved under 2× load. Volume growth without margin compression.
Nov–Dec curve visibly separated from full-year baseline — not a lucky one-day spike.
Three products scaled 3–5× simultaneously. Simultaneous multi-SKU growth is product-market fit — not a campaign spike.
Search drove the scale. Search CVR held at 2.88% under doubled traffic.
Google search at 2.88% CVR under doubled session load — structural, repeatable channel quality.
Brand and direct traffic held steady as search scaled — no single-channel dependency risk.
Supporting volume without carrying the event — search did the heavy lifting.
Structurally scalable. Not a lucky spike. These signals don't compound by accident.
Revenue tripled without AOV movement. Conversion improved under 2× load. Three products scaled simultaneously.
Search scaled at 2.88% CVR under doubled volume. Channel quality held — predictable, repeatable seasonal product-market fit.
6,562 new customers in 60 days. The audience expanded as efficiently as the revenue. 97%+ first-time buyers in both windows.
Launch Vector identifies the windows, builds the case, and structures the narrative — then executes the scale event.
Launch Vector helps ecommerce brands identify high-conviction growth windows and execute with institutional-grade precision. Let's talk about your next 60 days.
Launch Vector · Media Coverage
Launch Vector is featured in Yahoo Finance, Markets Insider, Street Insider, Digital Journal, CEO Magazine, Finance Digest, WSMV 4, and USA Today. View official citations, summaries, and outbound links for every Launch Vector press article on the dedicated press page.
View all 8 publications →Common questions about the Launch Vector Seasonal Commerce case study and post-close performance.
In this Launch Vector case study, revenue grew from $95K to $284K in 60 days (+198%) while conversion improved from 1.92% to 2.68% (+39.6%) and sessions increased 114%. The business scaled under higher traffic load without AOV inflation.
Launch Vector executed a structured 60-day scale event where sessions doubled and conversion rate improved simultaneously — a rare signal that the store performed better under pressure. Search drove the majority of revenue at 2.88% CVR under doubled volume.
Yes. This Launch Vector case study reflects anonymized post-acquisition performance from a cash-flowing ecommerce business. Capital partners co-invested above Launch Vector's $100K minimum capital requirement to obtain ownership before the scale event.
The case study includes direct Shopify Analytics screenshots: revenue momentum, session growth, customer acquisition, and sales by traffic source for the Nov–Dec 2025 operating window compared to the immediate prior period.
You can schedule a strategy call with Launch Vector at launchvector.com/schedulecall to review acquisition partner criteria, capital contribution requirements, and current co-investment opportunities.