€23.7K worst day · 2025
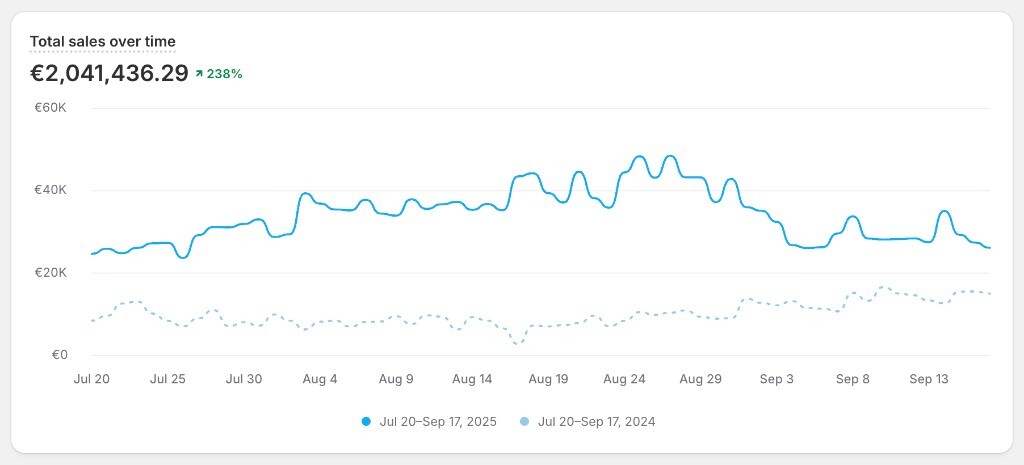
The 2025 lowest day outperformed the 2024 best day (€16.6K) by nearly €7K. The baseline — not the spike — is the story.


Launch Vector · Ecommerce Acquisition Case Study
This Launch Vector case study documents performance from a cash-flowing ecommerce business acquired through Launch Vector's partner program. Capital partners co-invested to obtain ownership in the operating company — each contributing above our $100K minimum capital contribution requirement. The results below reflect what happened after close, once ownership transferred and Launch Vector's execution framework was deployed.
Launch Vector Case Study · Summer Velocity · Jul 20 – Sep 17, 2025
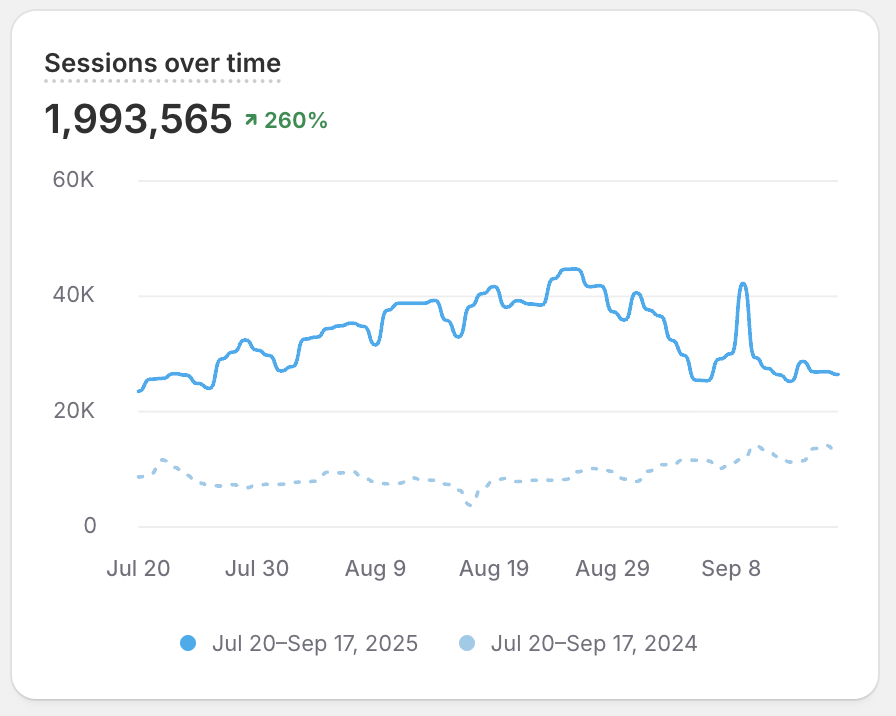
€2.04M in sales across a 60-day operating window — +238% year-over-year vs the same period in 2024. Nearly 2M sessions, 33,914 orders, and 32,210 new customers. Not a flash spike — a new sustained operating altitude with a rising daily floor.
Sixty days that redefined the operating baseline. €1.44M of incremental revenue vs the prior-year window — with daily consistency improving as much as peak-day performance.
The 2025 lowest day outperformed the 2024 best day (€16.6K) by nearly €7K. The baseline — not the spike — is the story.
Returning customer revenue grew 5.4× faster than new acquisition — maturing from transaction engine to relationship engine.
Top-product concentration fell from 44.5% to 24.3%. A diversified portfolio replaced single-SKU dependency.
Jul 20 – Sep 17 compared head-to-head. Same calendar window, same business — one year apart.
Jul 20 – Sep 17, 2024
Jul 20 – Sep 17, 2025
Direct exports from Shopify Analytics — sales velocity, session load, conversion funnel, device mix, and social referrer growth for the Jul 20 – Sep 17 window.
Source: Shopify Analytics · Client anonymized · Jul 20 – Sep 17, 2025
Demand was generated, qualified, and fulfilled at a fundamentally new tier — 21,611 incremental orders in a 60-day window without breaking average order value.
Peak day hit 763 orders (Aug 27). Volume scaled while fulfillment held.
Traffic sustained above prior-year levels across the full window — not a single-week spike.
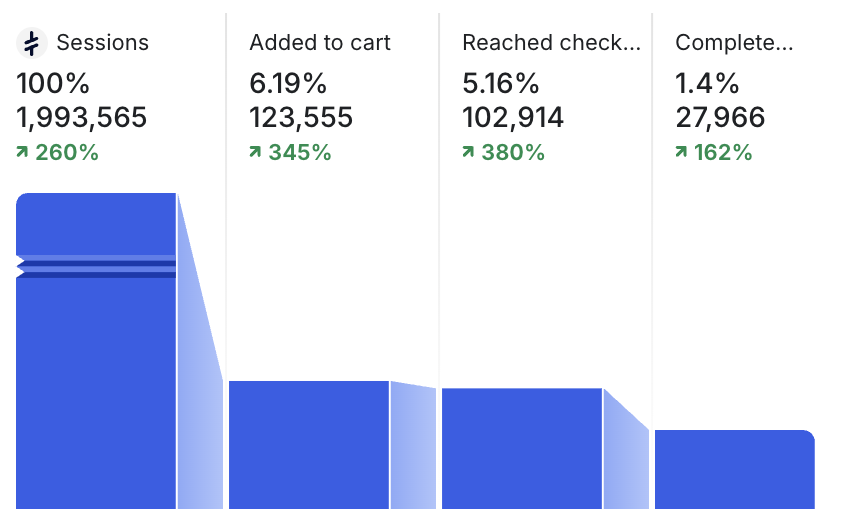
27,966 converted sessions. Checkout reach improved +380% YoY at higher traffic load.
Acquisition is loud. Retention is quiet — and far more valuable. This brand did both simultaneously.
From single-hero dependency to a diversified product engine. Revenue resilience improved structurally.
Jul 20 – Sep 17, 2024
Jul 20 – Sep 17, 2025
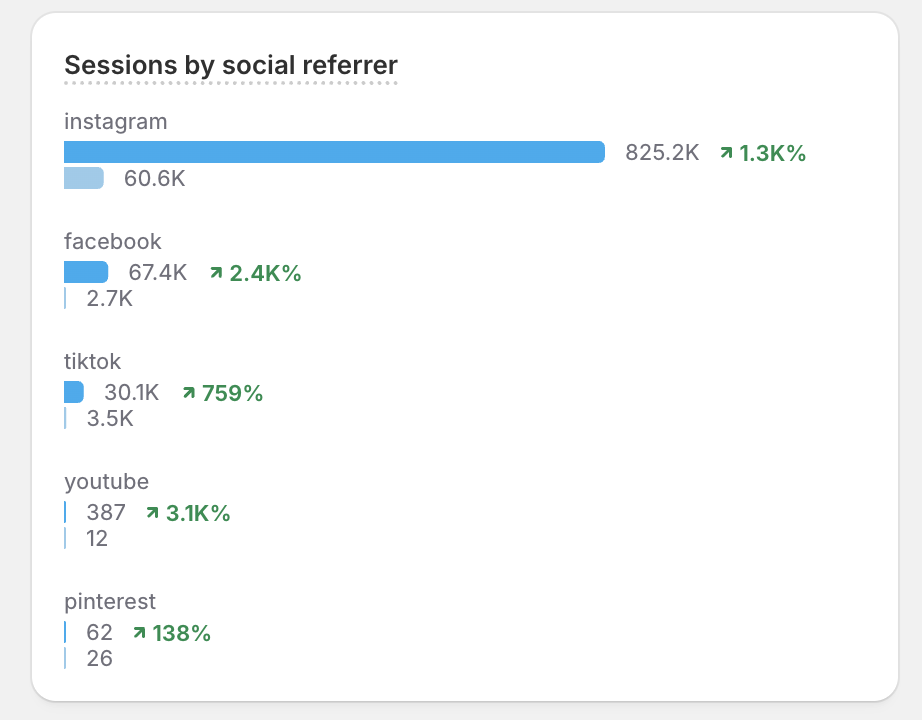
Multi-surface demand scaled together — Instagram-led social with breadth across platforms.
Primary social referrer at scale — repeatable top-of-funnel, not a one-off viral moment.
Secondary social surface contributing qualified traffic alongside Instagram.
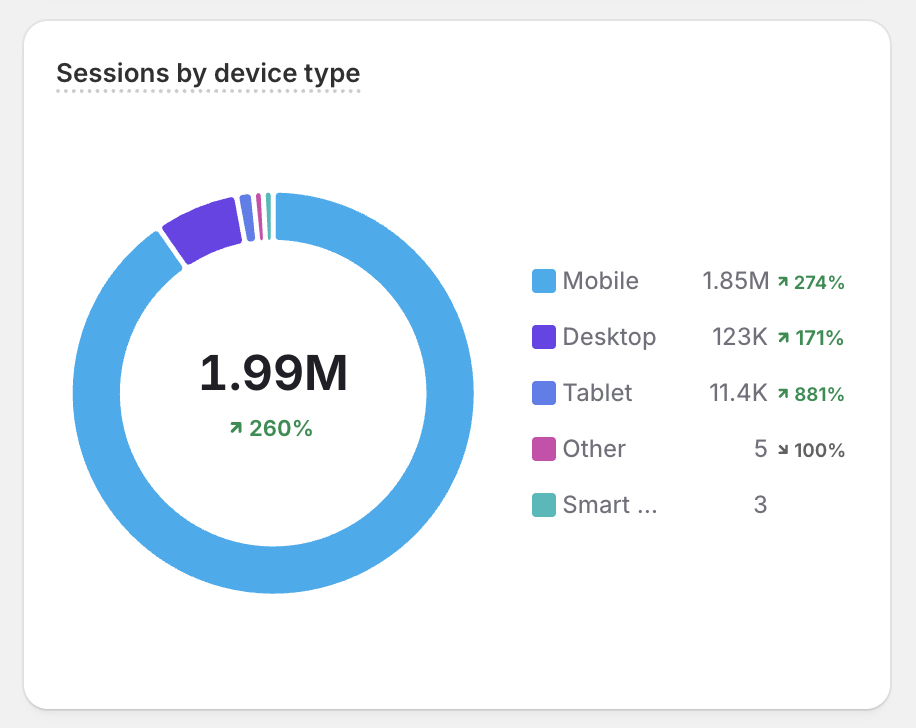
93% of session volume on mobile · +274% YoY. Built for how customers actually shop.
Structurally scalable. Not a lucky spike. These signals don't compound by accident.
€2.04M in 60 days · +238% YoY. €1.44M of incremental revenue in a single operating window — not modeled, measured.
Returning revenue grew 5.4× faster than new acquisition. The compounding customer base is now in place.
Top-SKU dependency cut from 44.5% to 24.3%. Portfolio diversification reduced structural risk.
The 2025 worst day beat the 2024 best day. Peak season became a baseline — a maturation story, not a growth story.
Launch Vector helps acquisition partners identify high-conviction growth windows and execute with institutional-grade precision. Let's talk about your next scale event.
Launch Vector · Media Coverage
Launch Vector is featured in Yahoo Finance, Markets Insider, Street Insider, Digital Journal, CEO Magazine, Finance Digest, WSMV 4, and USA Today. View official citations, summaries, and outbound links for every Launch Vector press article on the dedicated press page.
View all 8 publications →Common questions about the Launch Vector Summer Velocity case study and peak-season performance.
Summer Velocity is a Launch Vector case study covering Jul 20–Sep 17, 2025 — a 60-day peak-season window where total sales reached €2.04M (+238% YoY), sessions hit 1.99M (+260%), and returning customer revenue grew 677% versus the same period in 2024.
Launch Vector documents how the 2025 worst daily sales day outperformed the 2024 best day, top-SKU concentration fell from 44.5% to 24.3%, and returning revenue grew 5.4× faster than new acquisition — signals of durable brand maturation, not a one-week viral spike.
Shopify Analytics shows Instagram at 825K sessions (+1,300% YoY), Facebook at 67K sessions (+2,400% YoY), and mobile driving 1.85M sessions (+274%). Launch Vector scaled multi-surface social demand while maintaining checkout efficiency at higher traffic load.
Yes. Launch Vector anonymizes client brand and product identifiers in all published case studies. Performance metrics are sourced from Shopify Analytics; ownership and partner participation followed Launch Vector's co-investment model above the $100K minimum capital threshold.
Visit launchvector.com/casestudies for the full Launch Vector case study library, including Seasonal Commerce and Summer Velocity. Partners can schedule a call at launchvector.com/schedulecall to discuss fit and active opportunities.
Launch Vector press and media coverage from Yahoo Finance, Markets Insider, Street Insider, Digital Journal, CEO Magazine, Finance Digest, WSMV 4, and USA Today is indexed at launchvector.com/press with official citations and summaries for each publication.